
See how New York's commercial health plans deny claims.
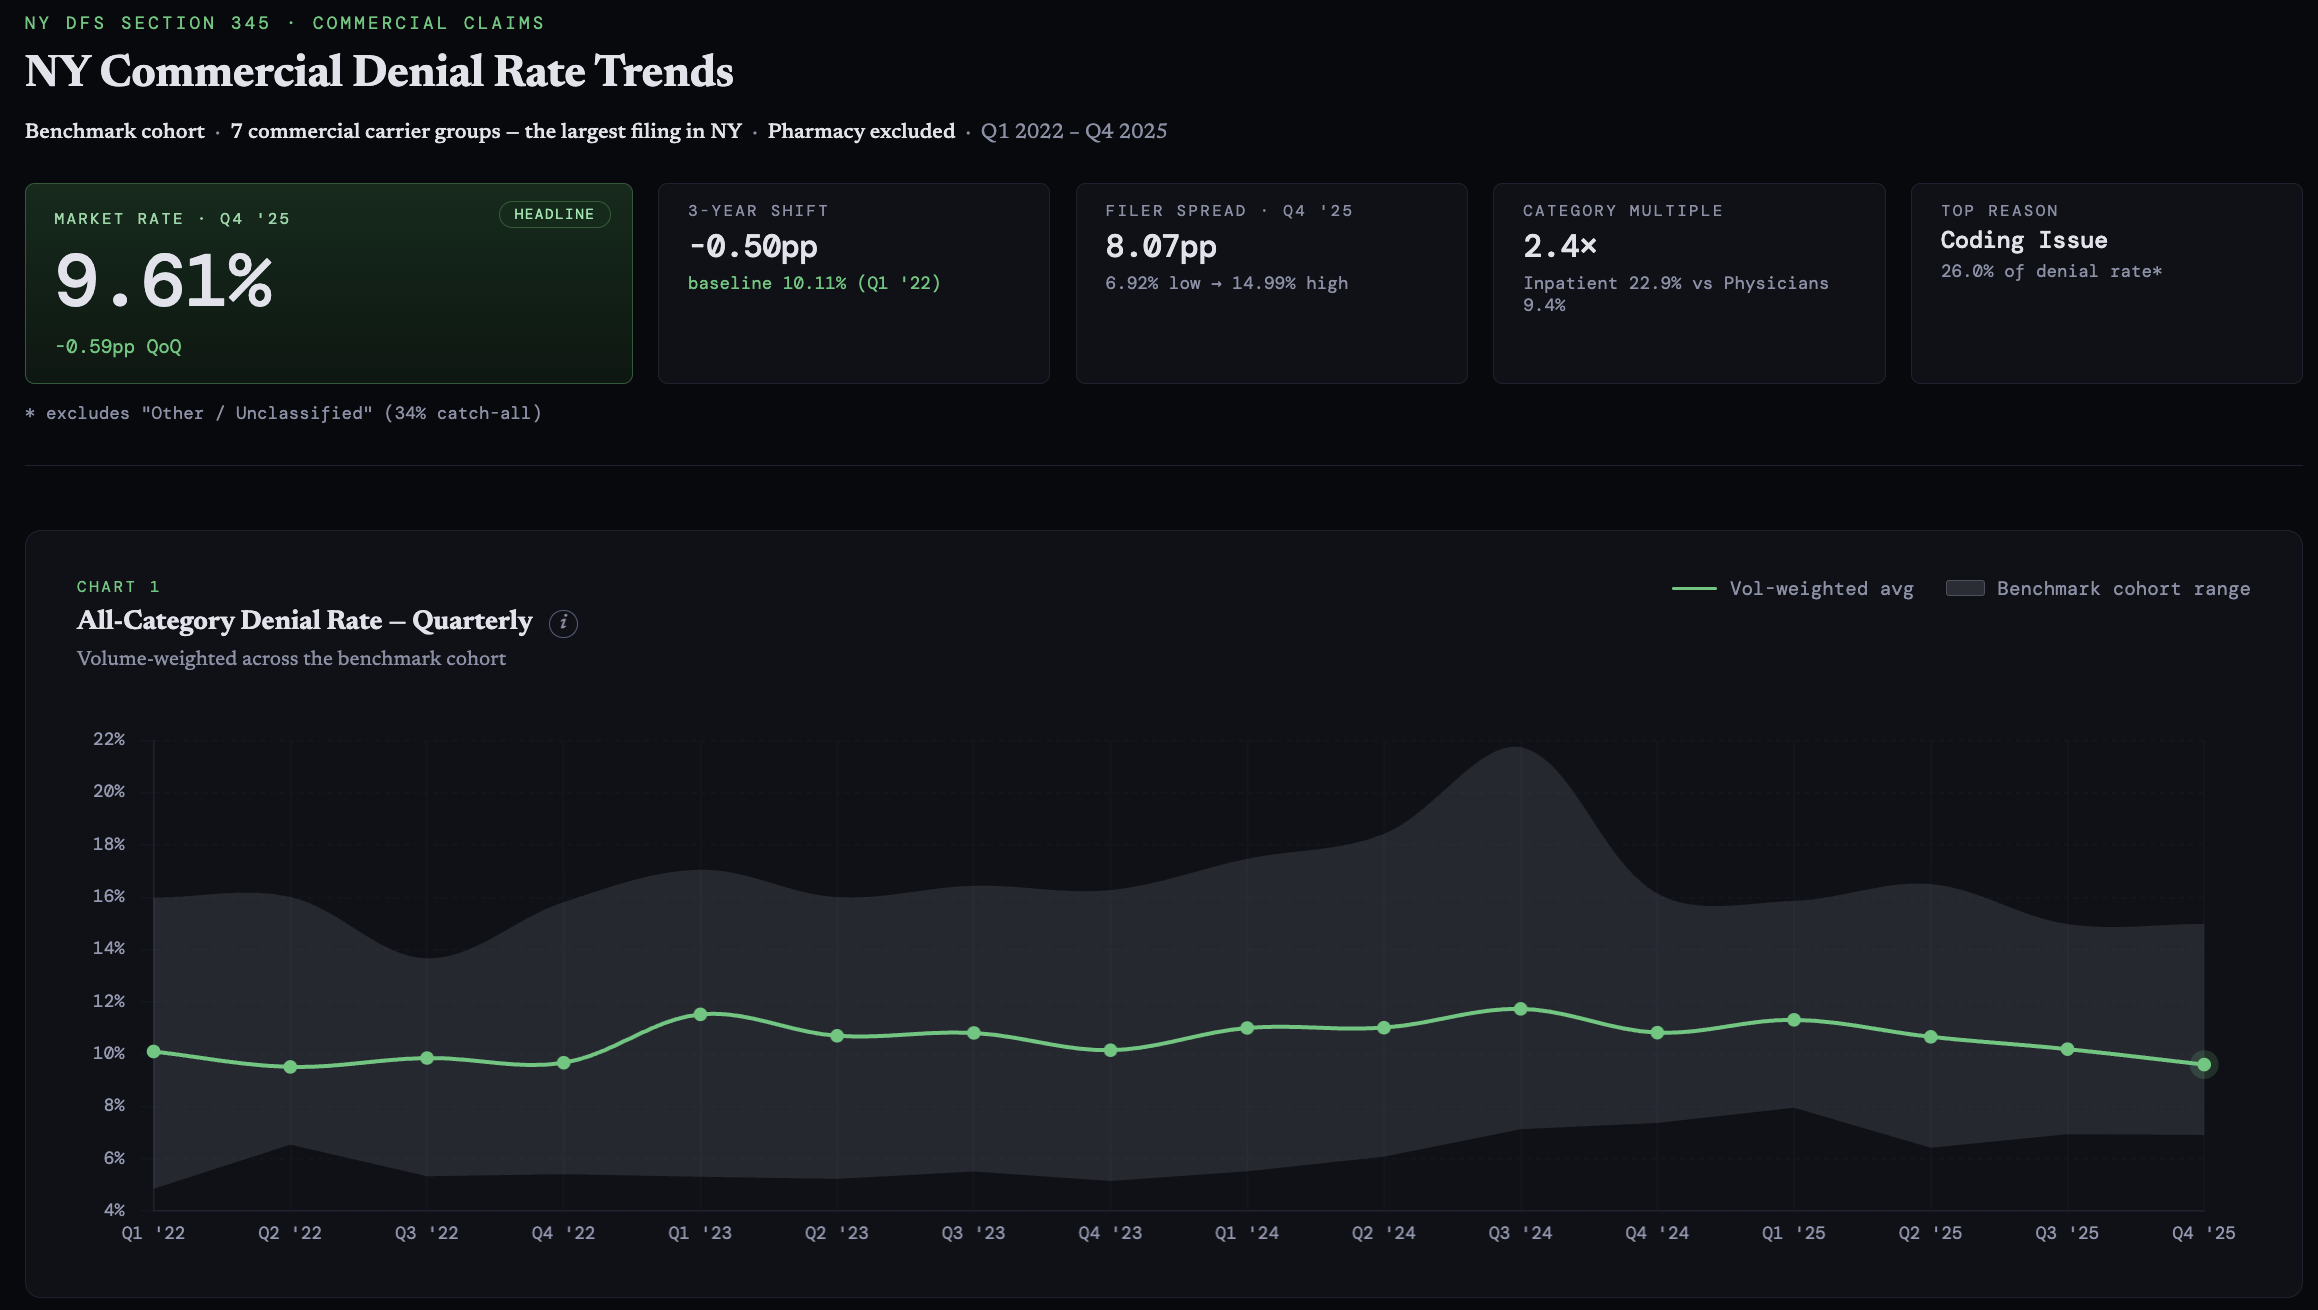
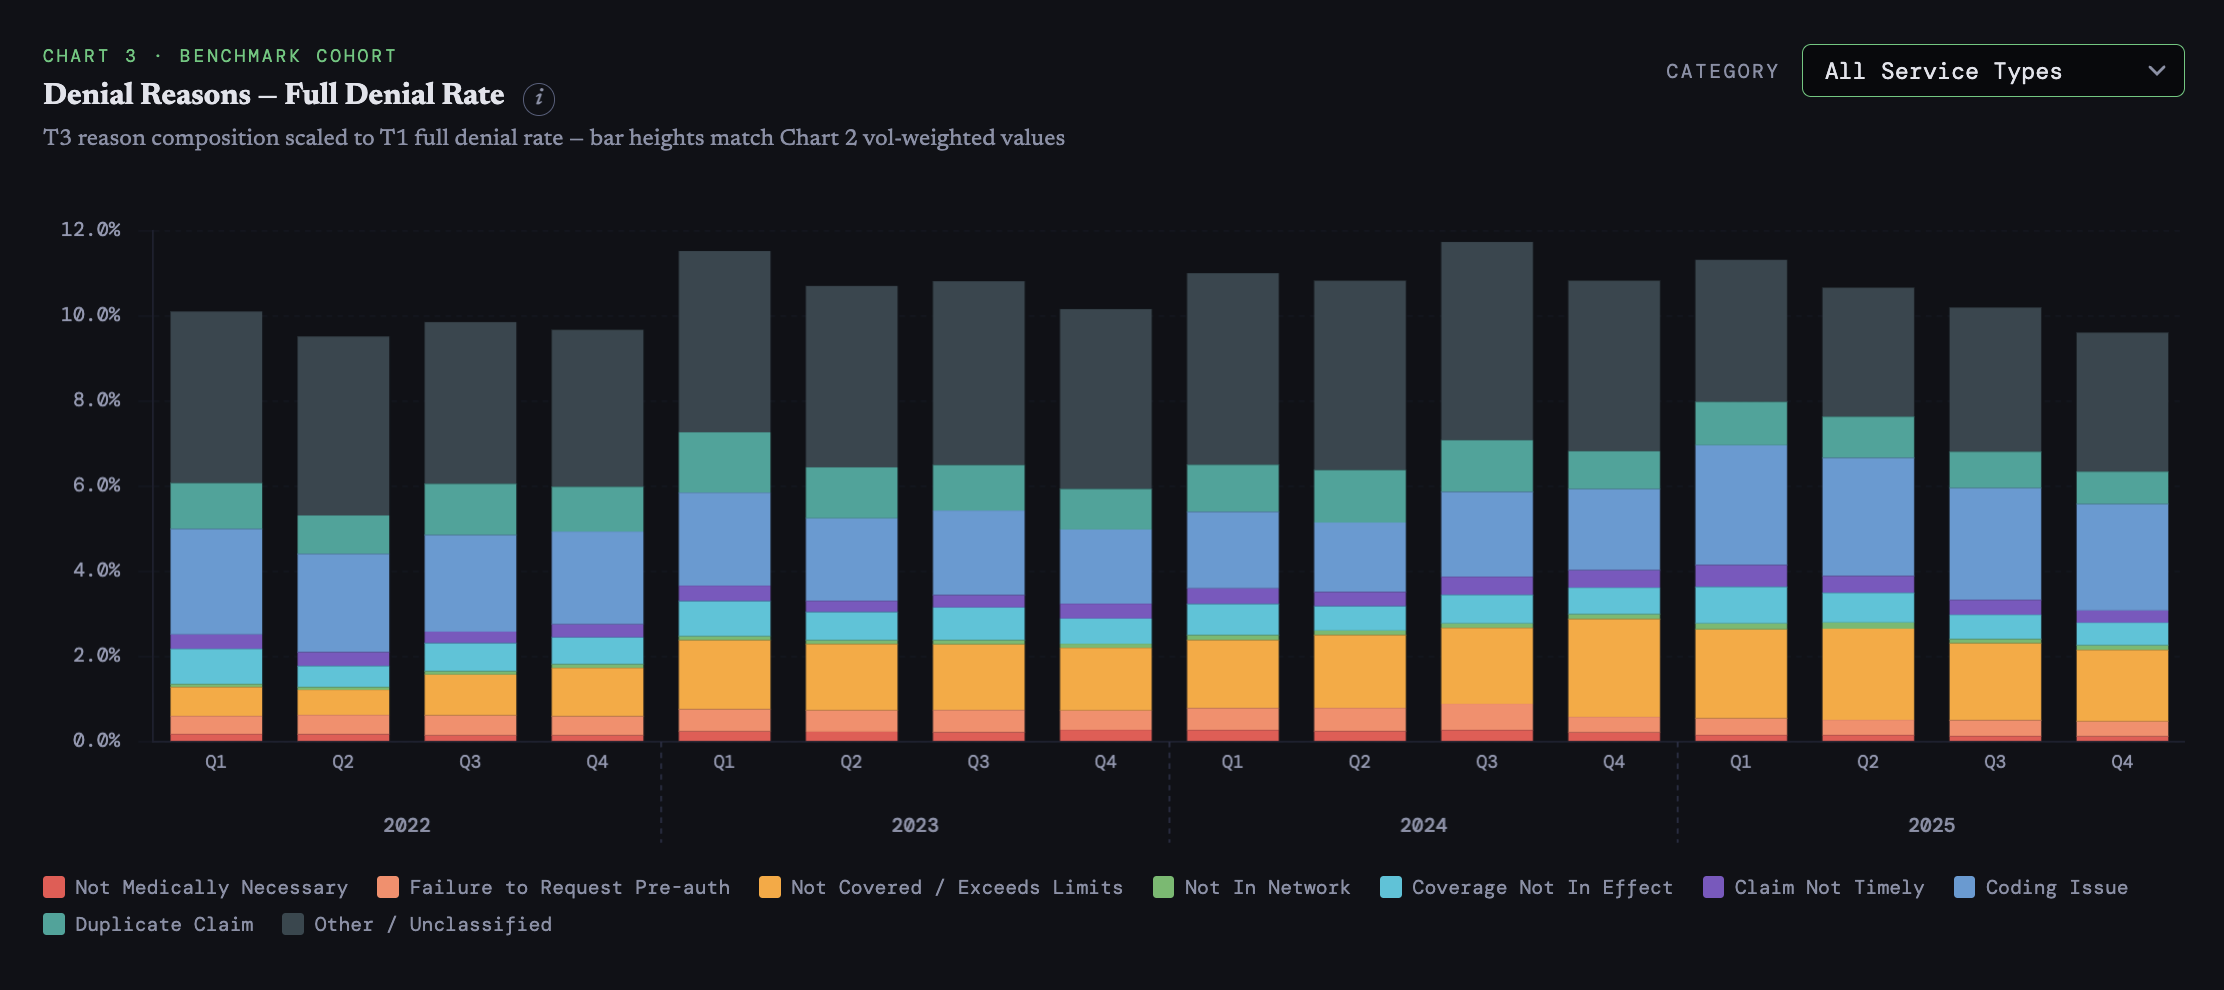
Fionda turns New York's regulatory filings into insurer-level benchmarks: denial rates, denied dollars, reasons, and appeal outcomes, compared across the market and down to the service category.
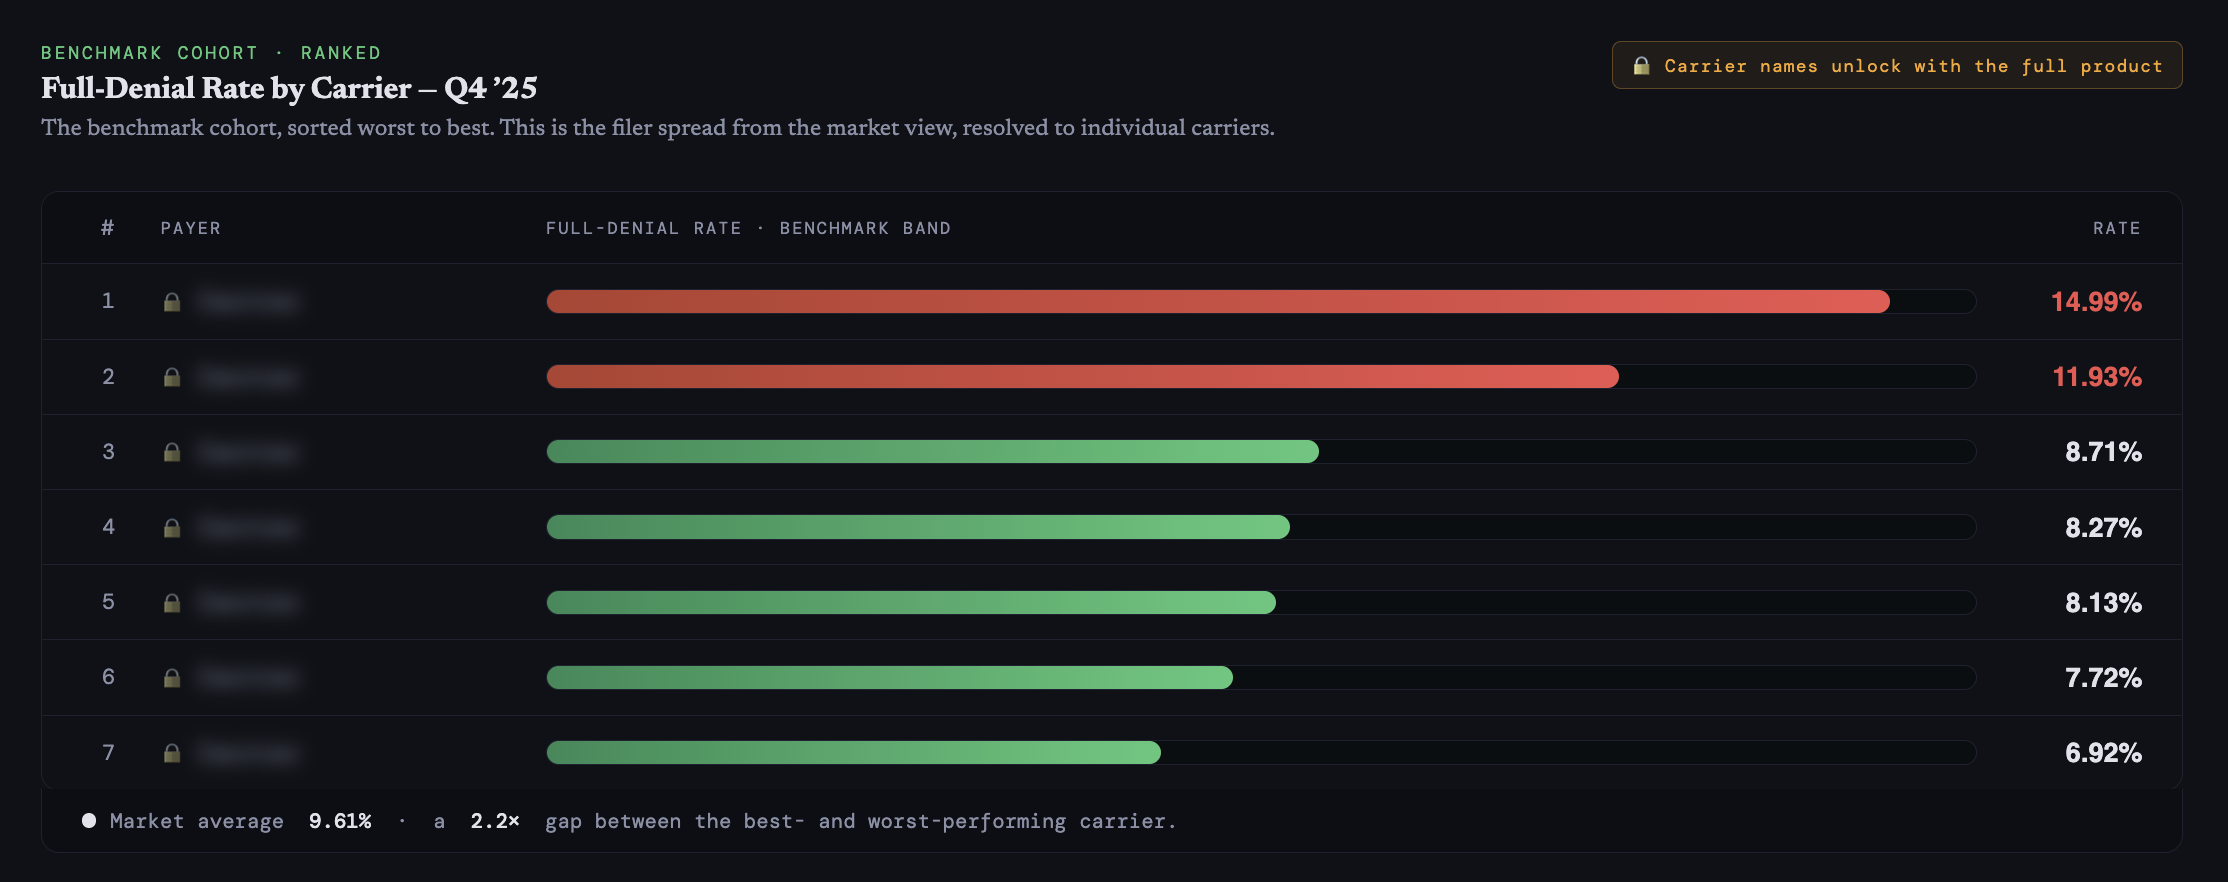
Fig. 1 · Denial rate by carrier — Q4 '25
Preview of the live demo · named carriers in the full product
1 / 3
What it is
- Comparative denial benchmarks across New York's commercial payers
- Resolution down to insurer by service category
- Drawn entirely from public regulatory filings: DFS Section 345 and CMS MLR
- Roughly 53% of the state's fully-insured commercial enrollment⁎
What it isn't
- A claims-workflow or denial-management tool
- Wired into your claims, EHR, or clearinghouse
- A view into self-insured (ERISA), Medicare, or Medicaid plans
- Pharmacy or formulary denials
⁎ Benchmark cohort, by covered lives. Filers below DFS reporting thresholds are excluded; coverage varies by quarter. Denial rates shown are full denials — claims denied in their entirety.